Back
Back


Application Performance Management (APM) is the monitoring and management of the performance and availability of software applications. The interpretation of APM can vary for different people and businesses. A very basic and most important reason for monitoring your Infrastructure and Application is achieving 100% uptime for your customers and stakeholders. Multiple applications have been built over time to allow developers to achieve the same.
For reading more on application performance management, visit.
Different organizations use different tools as per their requirements. With multiple solutions available at hand, it is tough to pick one since each of them have their pros and cons. At Shadowfax, we have tried a few as well, and as our application traffic increased over time, we wanted to set up more detailed alerts, such as when the error count of our APIs is higher than a certain threshold or the average response times of our tasks.
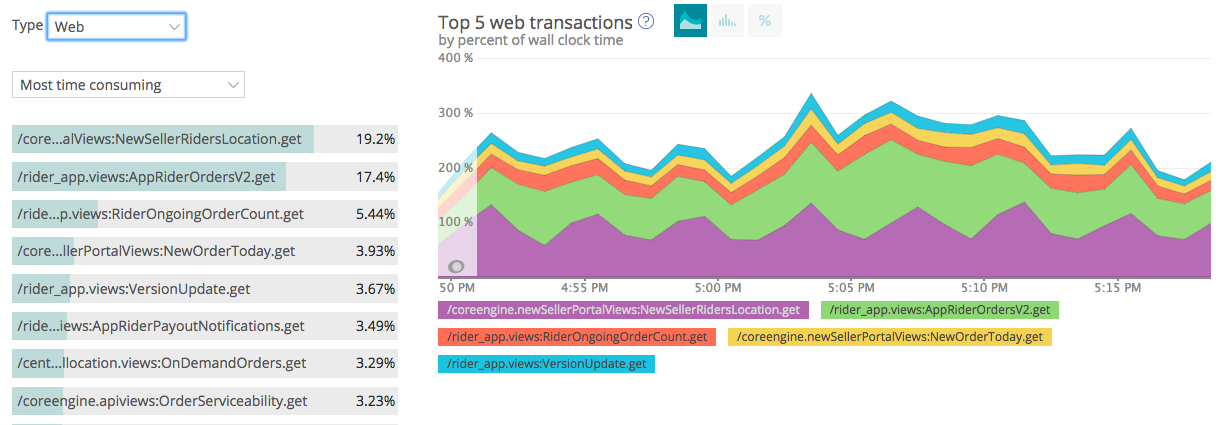
During our early days, we focused more on building features for our customers and for internal processes, and decided to start with New Relic APM Lite as our Monitoring Tool. It helped us to monitor our complete application performance, and a lot of issues were rectified to improve our overall response times. As a trial account, we were allowed to monitor our whole application i.e both web and non-web components.
As our application grew and our trial period with New Relic got over, we started to miss a lot of insights. We had no way to keep track of our servers, and our production servers would go down without our knowledge. Production Issues were reported mostly by our on-ground team when their applications stopped working. Even tracking just the disk usage was hard and resulted in downtime multiple times.
Back to the roots, we set up parsing over our server logs and inspected them each time something bad happened. Some of the usual problems that happened but went unreported included the following:
As our infrastructure grew, we started using ELK (ElasticSearch, Logstash, Kibana) for debugging production issues. We moved to central RabbitMQ, centralized our Celery nodes, and created Dashboards to monitor Nginx logs, MQTT stats, and visualizations for team-related metrics. We were using New Relic APM Lite along with Nagios and ELK.
With multiple monitoring tools to maintain, we wanted to upgrade our New Relic Subscription Plan and stop worrying. However, the Pricing Plan stopped us from doing it, and we decided to find an open-source solution.
With a little trial and error strategy, we decided to use Graphite with StasD and collectd. With multiple collectd plugins already available and easy integration of statsd with Django, it was a very easy transition. We used collectd to gather server metrics with plugins like collectd-rabbitmq and redis-collectd-plugin. To visualize our time series data for application and analytics, we used Grafana, which has a better visualization component than Graphite.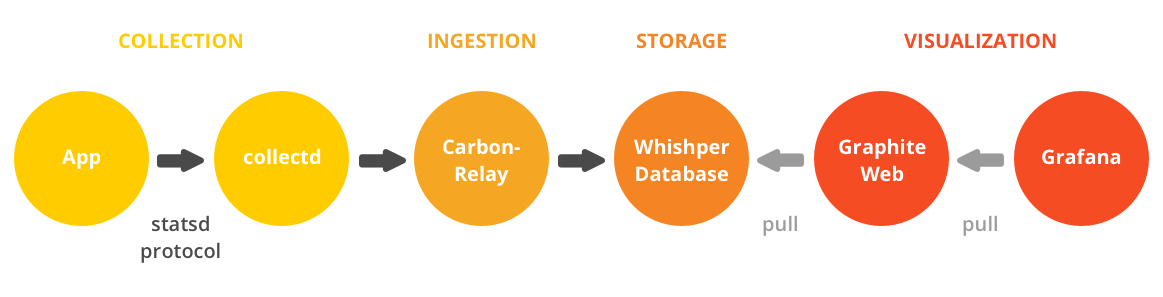
We also added authentication to ELK and used a self-hosted version of Sentry. What we achieved:
There is always a lot to refine, and with time, we would move towards clustering graphite to handle more data. We plan to stop using ElasticSearch as a datasource, as alerting is still not available in the current version of Grafana.
Hash Tags :
#shadowfax #3pl #thirdpartylogistic #logisticsservice #logisticsserviceprovider #APM
Related Blogs